Project #1: Image Mosaic
In this project, we will begin using images as a source of data! At the end of this project, you will have worked with images in python, analyzed images as a source of data, and created something uniquely your own!
- Part 1 is due: Wednesday, Oct. 30, 2019 at 11:59pm
- Part 2 is due: Wednesday, Nov. 13, 2019 at 11:59pm
Background: What is an Image Mosaic
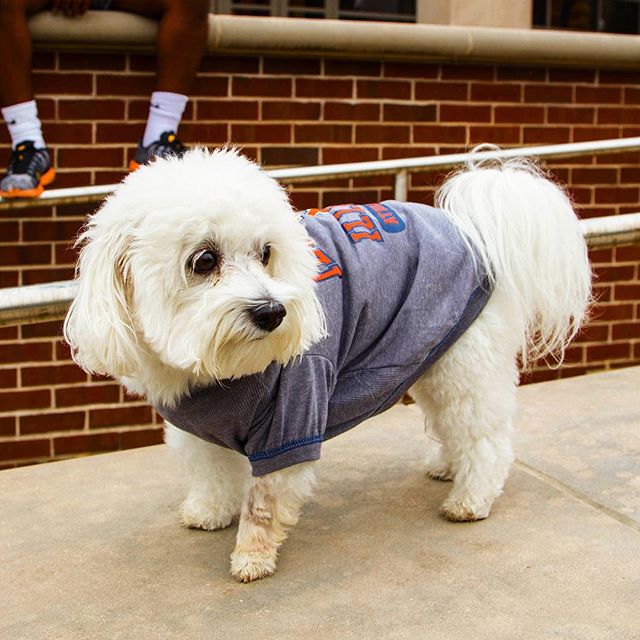
An image mosaic is an image entirely made up of other images. For example, below an Instagram post made by @illinois1867, our official Instagram account, and an mosaic of the same image made entirely out of images posted on @illinois1867.
 |
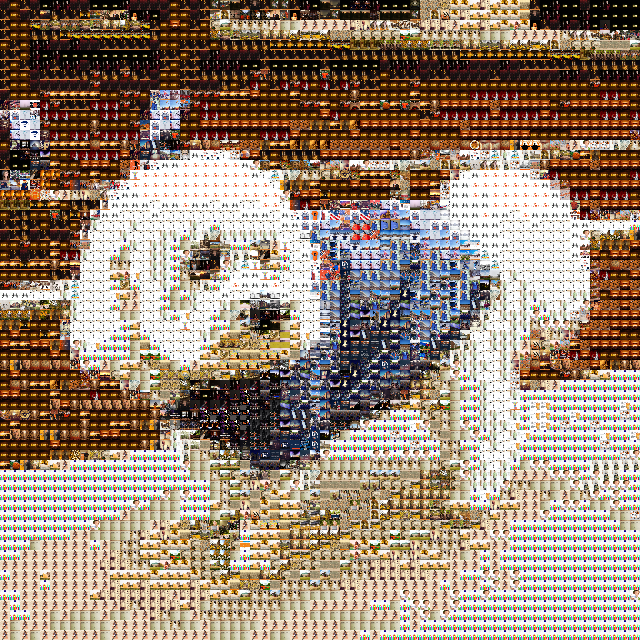 |
| Image from @illinois1867 | Mosaic made up images from @illinois1867 |
Milestones
For Project #1, you will build a program to create image mosaics just like this! There will be two parts:
-
First, you will gather and analyze images to be part of your set of “tiles” that will make up your mosaic. The more images that are used as tiles, the better looking the mosaic will be in the end!
-
Second, you will analyze a “mosaic image” that will be made into a mosaic. In doing this, you will look at small squares of the mosaic image and find the best match among all of your tiles from the first part.
Let’s get started!
Part 1: Tile Images
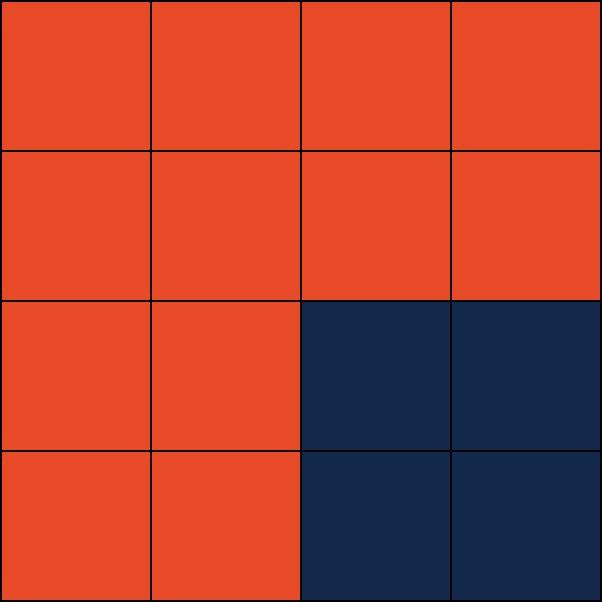
Let’s start with something really basic. Here is a blown up version an image made with Illini Orange and Blue that is exactly 4 pixels by 4 pixels, side-by-side with it labeled with the (x, y) coordinates of each pixel:
 |
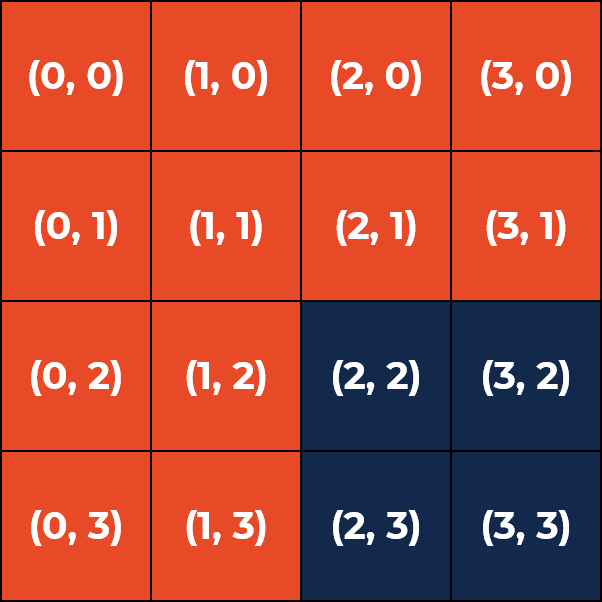 |
| Zoomed-in version of `4x4-ex.png` | Labeled |
We will use this sample image when developing our algorithm.
Part 1a: Algorithm Goals
The goal of our algorithm is to create a function that finds the average color of an image. Specifically, this means that we want to find the value of each pixel’s color and divide it by the total number of pixels. To do this, we need to visit every pixel.
Our algorithm has several steps:
- Read the image into Python
- Convert the color system to Lab
- Find the
widthandheightof the image - Visit every pixel in the image, storing the color of the pixel
- After every pixel is visited, find the average image color for the full image
- Return the average image color (as a dictionary containing
L,a, andb)
We’ll help you out on each one!
Part 1b: Getting Ready for the Project
We will be using the scikit-image and pillow Python libraries to help us analyze our image. Let’s get them installed!
At your command line, run the following code to download these libraries so you can use them in Python:
conda install -c conda-forge scikit-image
conda install -c anaconda pillow
Merge in the starter code for this project:
git fetch release
git merge release/project1 --allow-unrelated-histories -m "Merging initial files"
Finally, open up a Jupyter Notebook and go to project1 and project1-part1.ipynb
Part 1c: Programming
Open up project1-part1.ipynb for Part 1:
Algorithm Overview
In the code below, a function outline has been provided:
def findAverageImageColor(fileName):
    # Your code here! :)
All of your code will go inside of this function.
Algorithm Step 1: Reading an Image
Similar to pd.read_csv, we need to read the image into Python. Since it’s not a CSV file, we need a different library to load this in.
Take a look at the skimage.io.imread() documentation. In the docs:
- The function to read an image is
skimage.io.imread(...) - The first parameter given to the function is the filename.
- The result value of the function is the colors of the pixels in the image.
Use skimage.io.imread() to read the image passed into the function. The only parameter needed is your filename, fileName, which is passed into your function. Store the result of the function in a variable.
Algorithm Step 2: Convert the color system to Lab
According to the skimage.io.imread() documentation, the default color system returned is RGB or Red-Green-Blue.
- RGB describes colors by their physical properties (red, green, and blue are the primary colors of light).
- However, our eyes see wavelengths of light differently (we see green light more than blue light) so a small change in blue does not have the same effect as a large scale.
- CIELAB, Lab, or simply “Lab” is a color system designed to be perceptually uniform. That means any change in any of L, a, b should change our perception of color the same amount. (You can read more on CIELAB on Wikipedia.)
If your output from Step 1 is stored in the variable rgb, use the following code to convert from RGB to LAB:
lab = skimage.color.rgb2lab(rgb)
Algorithm Step 3: Find the width and height of the image
The width and height of the image can be found by checking the length of the list storing our color data. Here’s the exact code needed to store the width and height:
width = len(lab)
height = len(lab[0])
Algorithm Step 4: Visit every pixel in the image, storing the color of the pixel
To visit every pixel in the image, we can make use of the for loop we have been using for weeks. To visit every x and every y, we need a nested for-loop. Here is the exact code to store the variables L, a, and b for each pixel:
for x in range(width):
    for y in range(height):
        L, a, b = img[x][y]

        # At this point, the variable `L` stores the `L` value for the pixel at (x, y),
        # ...`a` stores the `a` value, and
        # ...`b` stores the `b` value
        #
        # You will need to save this data or keep a running count of all the L, a, and b values
        # in order to find an average after running the for-loop.
As noted in the comments, you must keep track of the values somehow. You can use a DataFrame (like we did with simulations) or use multiple counters to keep track of the sum – you just need to be able to find the average value for the entire image later! :)
Algorithm Step 5: After every pixel is visited, find the average image color for the full image
After the for-loop is complete, you must find the average L, a, and b value for the entire image.
Hint: The total number of pixels is width * height.
Algorithm Step 6: Return the average image color
Finally, you must return the average color of the image. The return value must be of the format:
return {'L': L, 'a': a, 'b': b}
…where L, a and b is the average color of the entire image.
Testing your Algorithm
Once your algorithm is complete, you can run the test cases inside of the Jupyter notebook.
Part 1d: Your Images
Edit the Code
The only thing you need to change in Part 1d is the first line of code. Change the first two lines of code to the following:
# What directory includes the images?
imageDir = "tile-images"
Add Your Images
The last part of Part 1 of this project is to grab all your tile images and find all of their average color values!
-
Add images you want as your tile images into the
tile-imagesfolder inside ofProject 1. You can download them from your iCloud, Google Photos, Instagram, anywhere! (Thetile-imagesfolder isn’t turned in – we will never see your tile images – and this directory will probably be very large!) -
If you need some more images, here is a download that contains all of Illinois’ images from Instagram.
Once your tile-images directory is ready, you can run Part 1d in the notebook!
- The code will call your function for every single image file inside of
tile-images. - At the end, the code will save the average values of each image in a CSV file called
tile-images.csv.
Optional: Pre-process Your Images
If you find your program takes a LONG time to run, if you have errors with grayscale images, or find the Mac OS X file .DS_Store showing up in your tile-images directory, you can pre-process your tile-images folder. To do this, do the following:
git fetch release
git merge release/project1-preprocess --allow-unrelated-histories -m "Merging initial files"
This will add project1-pre-process-tile-images.ipynb to your project1 directory. You can read the details in that Notebook! :)
Part 2: Image Mosaic
Now you get to build your own mosaic! Check out project1-part2.ipynb to get started!