Due Date Update – Online Transition
Per our online transition plan, the due dates have been updated:
- Due for 105% credit by April 2, 2020 at 11:59pm
- Due for 100% credit by May 6, 2020 at 11:59pm
Project #1: Image Mosaic
Here is one of my absolute favorite photos from the @illinois1867, Illinois’ official Instagram account:
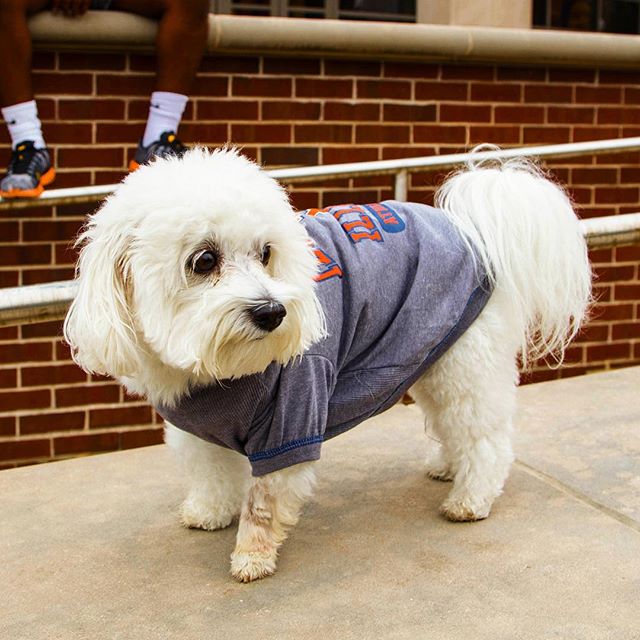 |
| Image from @illinois1867 |
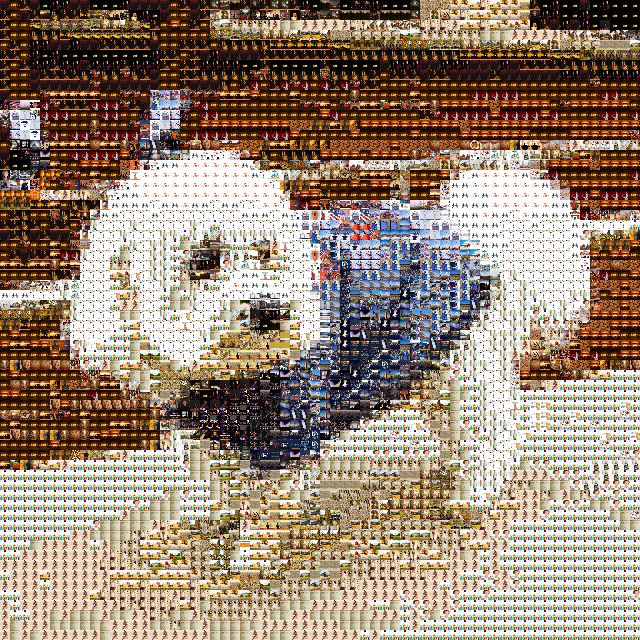
What if we used Data Science to transform this image into something amazing? This project will have you apply your Data Science skills to creating an image mosaic out of any image you have made up entirely of your other images! For example, here is the mosaic I created when developing this project – the picture on the left is entirely made up of only images from @illinois1867:
 |
 |
 |
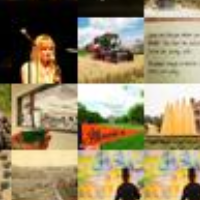 |
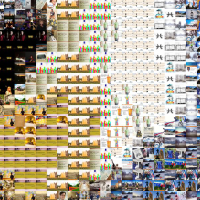
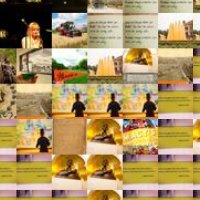
| Mosaic made up images from @illinois1867 | 5x Zoom | 25x Zoom | 50x Zoom |
To complete this, you will need to do three things:
-
Find a base image that you want to make into a mosaic. This can be any image but a photo usually works best.
-
Find a lot of tile images that you want to use as your mosaic tiles. You can use the set of images from Illinois’ Instagram account to start with (a link to download them is in Part 1d, which is when you’ll need them.)
-
An algorithm – that we will help you develop – to find the best tile image to replace for every region of the base image.
We’ll get back to the base image and tile images later because we need the algorithm first.
Algorithm Overview
Whenever you develop an algorithm, we want to begin with a simple example and work up. Instead of thinking of all the tile images you will be using, let’s consider just four tile images as our set of tile images:
 |
 |
 |
 |
| tile1.png | tile2.png | tile3.png | tile4.png |
The goal is to create a mosaic out of the tile images that resembles the basic image. Instead of thinking of all of the possible regions for an image, let’s consider our example image with just 16 regions:
|
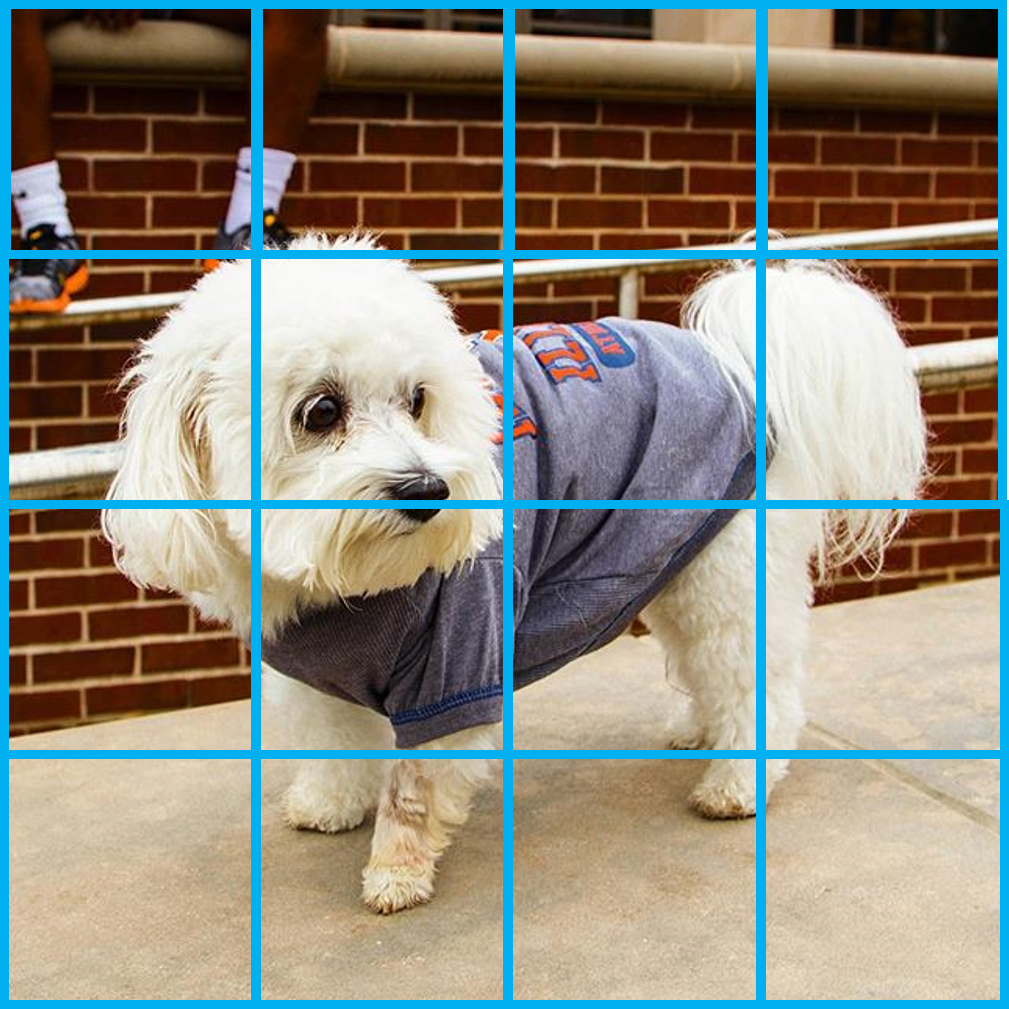 |
| base.jpg | base.jpg with a grid overlay |
An algorithm to accomplish this can be described by the following logic:
# Algorithm Step 1: Find the average color of every single tile image
# Algorithm Step 2: Find the average color of every single region in the base image.
# Algorithm Step 3: Replace every single region of the base image with the best matching tile form the tile images
You’ll do “Algorithm Step 1” in Part 1 of this project and “Algorithm Step 2” and “Algorithm Step 3” in Part 2 of this project and then be able to create your own mosaic! :)
Part 1: Tile Images
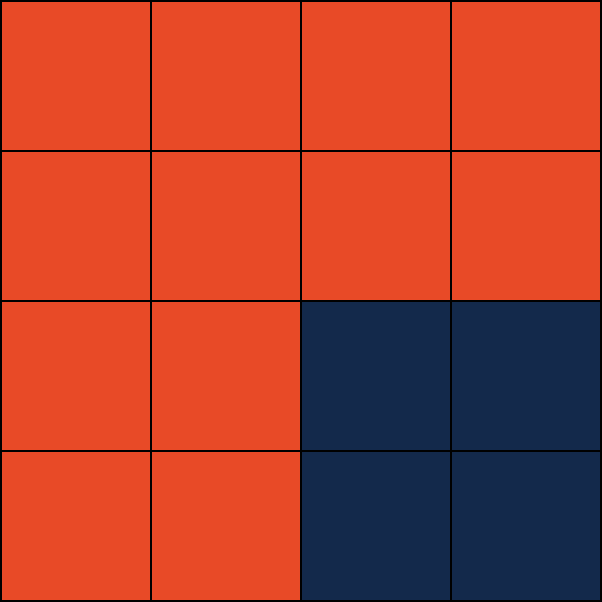
As you learned in lecture, an image is a series of pixels that each have a location (an x and a y) and a color value (an L, a, and b value). For example, here is a extremely zoomed in version of a 4 pixel by 4 pixel image:
 |
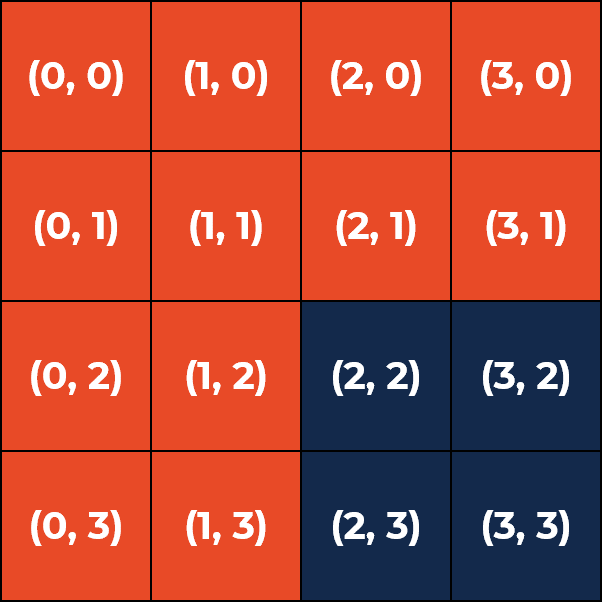 |
| Zoomed-in version of `4x4-ex.png` | Labeled with (x, y) locations |
There are two different colored pixels in this image:
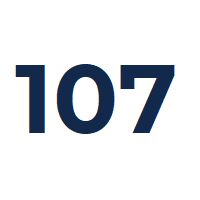
- The pixel at
(0, 1), and all other orange pixels, is “Urbana Orange” and has the color value of (L=54.24,a=59.33,b=52.98). - The pixel at
(3, 2), and all other blue pixels, is “U of I Blue” and has the color value of (L=16.66,a=4.49,b=-23.67).
To find the average image color, we need to only to find the mean of the L, a, and b values across all pixels. Since there are 12 orange pixels and 4 blue pixels, the average L value would be ((54.24 * 12) + (16.66 * 4)) / 16 or L_avg = 44.85. Similarly, a_avg = 44.85 and b_avg = 27.43. (This text is exactly the that average color – a darker, more-red orange.)
Getting Ready: Libraries and Code
We use scikit-image, pillow, and numpy Python libraries to help us analyze our image. Let’s get them installed!
At your command line, run the following code to download these libraries so you can use them in Python:
conda install numpy
conda install -c conda-forge scikit-image
conda install -c anaconda pillow
In your stat107/netid directory, merge in the starter code for this project:
git fetch release
git merge release/project1 --allow-unrelated-histories -m "Merging initial files"
Finally, open up a Jupyter Notebook and go to project1 and project1-part1.ipynb
Writing the Code - Algorithm Step 1
The goal of our algorithm, as described, is to create a function that returns the average color of an image. For this function, we will provide you with three input parameters:
lab, a two-dimensional list of pixels colors – we’ll explore how to access a pixel shortlywidth, the width of the imageheight, the height of the image
An empty function with these parameters is already defined in the Python notebook for you to complete:
def findAverageImageColor(lab, width, height):
    # Your code here:
    ...
Step 1a: Visit every pixel in the image, storing the color of the pixel
To visit every pixel in the image, we can make use of the for loop we have been using for weeks. To visit every x and every y, we need a nested for-loop. Here is the exact code to store the variables L, a, and b for each pixel:
for x in range(width):
    for y in range(height):
        L, a, b = lab[x][y]

        # At this point, the variable `L` stores the `L` value for the pixel at (x, y),
        # ...`a` stores the `a` value, and
        # ...`b` stores the `b` value
        #
        # You will need to save this data or keep a running count of all the L, a, and b values
        # in order to find an average after running the for-loop.
As noted in the comments, you must keep track of the values somehow. You can use a DataFrame (like we did with simulations) or use multiple counters to keep track of the sum – you just need to be able to find the average value for the entire image later! :)
Step 1b: After every pixel is visited, find the average image color for the full image
After the for-loop is complete, you must find the average L, a, and b value for the entire image.
Hint: The total number of pixels is width * height.
Step 1c: Return the average image color
Finally, you must return the average color of the image. The return value must be of the format:
return {'L': L_avg, 'a': a_avg, 'b': b_avg}
…where L_avg, a_avg and b_avg are the average color of the entire image stored as L, a, and b.
Testing your Algorithm
Once your algorithm is complete, you can run the test cases inside of the Jupyter notebook.
Part 1 – Image Analysis
Your code is complete – now we can use it! :)
Add Your Images
The last part of Part 1 of this project is to grab all your tile images and find all of their average color values!
-
Add images you want as your tile images to a folder inside of
Project 1. You can download them from your iCloud, Google Photos, Instagram, anywhere! (The tile images folder isn’t turned in – we will never see your tile images – and this directory will probably be very large!) -
Specify the name of your tile images folder in
project1-settings.ipynb. -
If you need some more images, here is a download that contains all of Illinois’ images from Instagram.
Once your tile images directory is ready, you can run Part 1 Image Analysis -- Your Images in the notebook!
- The code will call your function for every single image file inside of the directory.
- At the end, the code will save the average values of each image in a CSV file called
tile-images.csv.
Configure Algorithm Parameters
The notebook project1-settings.ipynb allows you to configure options about the project. Use this file to make your image higher quality, run faster, or a number of other options! :)
Part 2: Image Mosaic
Now you get to build your own mosaic! Check out project1-part2.ipynb to get started!